



The Rebound
Finally, some reprieve in July. After declining for four consecutive months, July saw gold prices up 0.8% for the month and August is looking like a very solid month as well.
Market talk has been of more central bank buying and Treasury bond buybacks, but what is our own gold model saying?
As a reminder, the model exited long positions at the end of January and has held that status up until now.
Here’s our previous report:

Performance
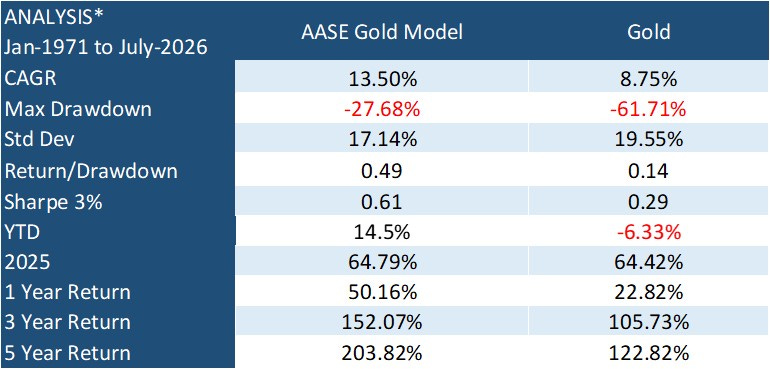
For the month of July, our model’s return was 0.27%, representing interest on cash freed up from the sale of our gold at the end of January, while YTD the return has been 14.5% versus gold’s -6.3%.
Here’s our summary table:
This looks as follows graphically:
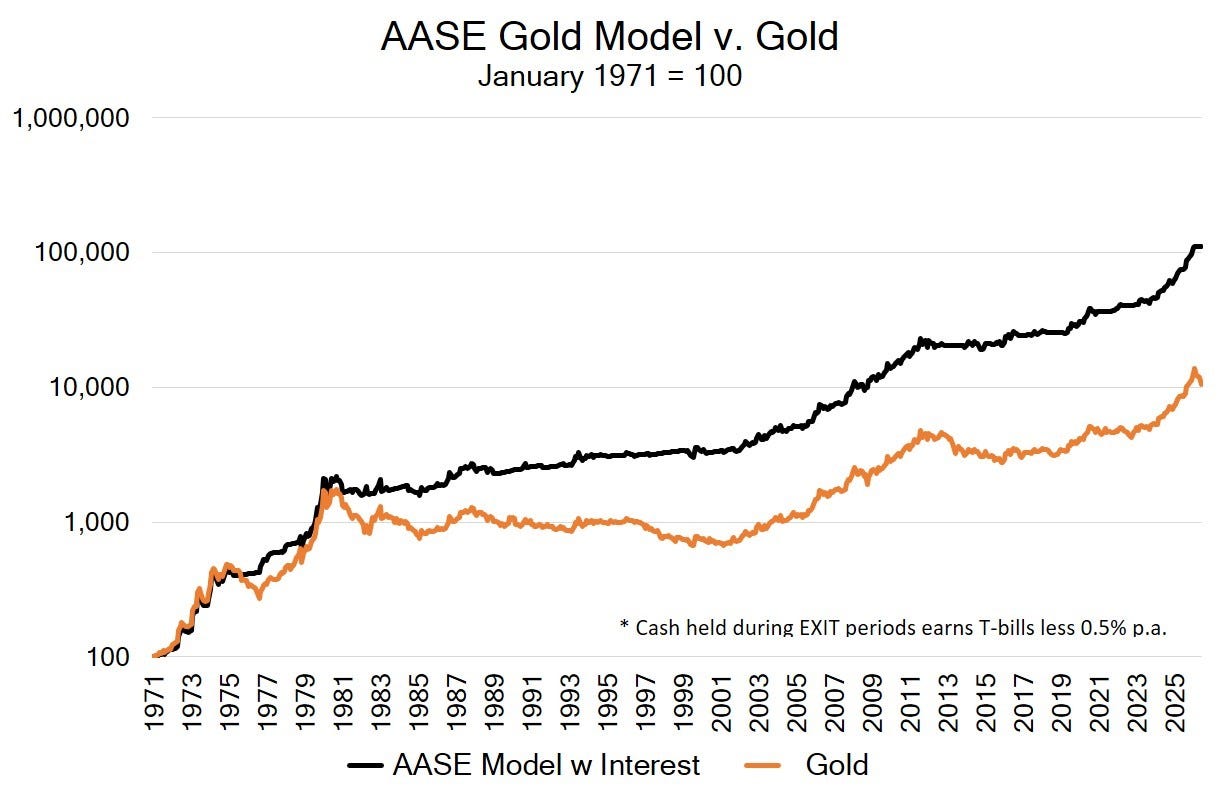
Remember, our model consists of a core of two monetary signals - highly weighted - together with a periphery of two momentum signals - lightly weighted.
Gold and Money
We continue to focus on the primary driver of gold price fluctuations as being lagged changes in the rate of growth in the money supply.
In order to try to minimise whipsawing, we augment this core monetary approach with momentum filters, as time lags can change & these momentum filters can remove some of the noise associated with those changes.
The aim is to help better time the acquisitions of gold and, for those who wish, the reduction of exposure in times of expected corrections. The advantage of this approach is that the money supply growth rate is a leading indicator & it allows us to plot the expected path of gold’s movements ahead of time. This means that we know our positioning ahead of time.
This is where money printing comes into play. Not what is expected by the Fed or any other central bank, but what they have already done and its lagged impact on activity and more importantly prices!
The Model’s Components
As we have described in previous posts, there are three high-level inputs in our monetary gold model:
Input 1: The money supply (i.e. “Adjusted Money Supply” or “AMS”) model. This looks at the cyclical pattern of money supply growth, with the money supply itself being defined using the principles of Austrian economics. When the AMS cycle moves into its most negative stage, with a value below 0.5 (think of it like a PMI indicator) and with a declining trend, this gives a negative signal. In the absence of shorting gold this could be translated into removing, reducing or hedging exposure.
Input 2: Price technical indicators. We use two different price momentum indicators and each of these also gives either a positive or negative value.
Input 3: Multi-country monetary momentum gold indicator. This is our multi-country money supply (AMS) gold leading index. It encompasses the money supply growth rates of the major countries involved in the gold market and is lagged so as to give an indication of the likely future momentum of the gold price. Rising momentum generates a positive signal while falling momentum produces a negative signal. The signals from this component are longer-term in nature.
We weight and aggregate the signals from these indicators and derive a composite value that is positive or negative. A positive value corresponds to a Long position while a negative signal means Exit for the purposes of calculation of performance.
So, how is the model positioned for September?
