


Money Supply & Macro Weekly #10
Big moves in commodity prices

A wild week for commodities saw some major swings during the week in various markets.
We begin with precious metals, which appear to have finally decided to join the rally with Gold. Over the week the price of Platinum rose by 5%. This followed the large 10.7% gain the week before and year to date its price is up by a massive 33.5%. Platinum ended the week at $1,227USD/oz., its highest level since April 2021.

The large increase has come as a surprise to many, even outstripping Gold this year which has “only” risen by 31%. However, whilst Gold rose by over 27% in 2024, Platinum fell last year by 6.9%. Whilst the recent rally appears to have caught many off-guard, multiple factors have been argued to explain this recent increase, ranging from physical supply/demand issues to geopolitical developments. As always we prefer to focus on our strengths and present the monetary conditions and their impact on these markets.
Not surprisingly, and as with most other commodities, China is the world’s largest consumer of platinum, followed by the Eurozone and the USA. Combining the money supply between those countries provides an interesting insight into where the momentum of Platinum is heading. As a result of pressure exerted by the lagged money supply growth of those three economies, it seems that the momentum of Platinum is still well supported.

Silver has also risen quite strongly over the past two weeks: up by around 10%.
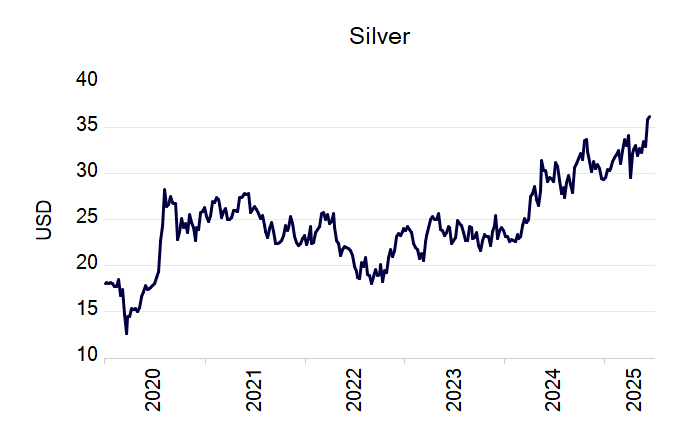
The rally in Silver for the first half of this year has already equaled the overall performance for all of 2024, with the metal up by almost 24% year-to-date. The reversal of the trend in the Gold:Silver ratio indicates that silver is gaining relative to gold perhaps reminding investors of its benefit, too, as a safe haven in volatile periods.

Taking into account the money supply of some of the world’s largest consumers of Silver including India, USA and the UK, we can also observe that this strengthening in the momentum of Silver is (as with Platinum) in line with monetary factors.

Oil ended the week with some large price increases. predominantly in response to the Israel-Iran conflict. Over the week the price of WTI Crude Oil jumped by 13.1%.
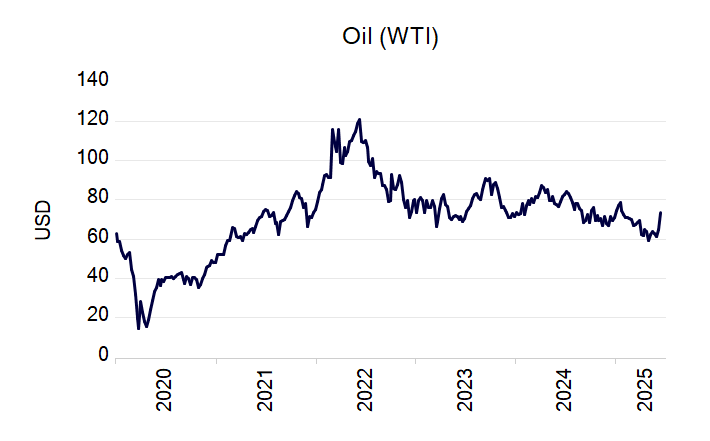
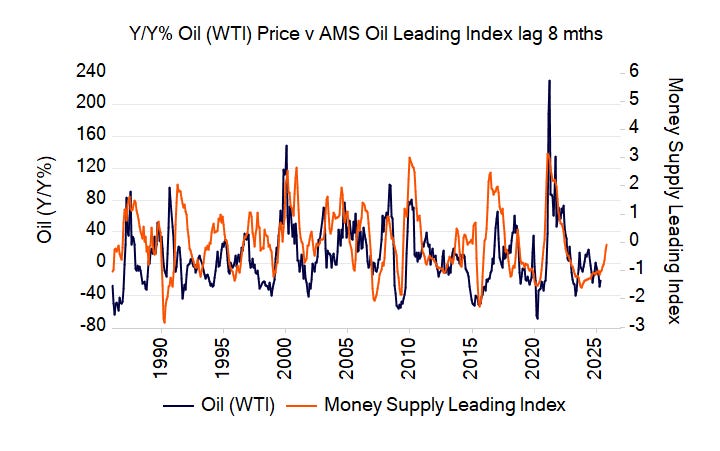
From a monetary perspective, when we combine the money supply growth rates of some of the largest economies in the world (such as the US, China, Europe, Japan, China, Brazil and India), we see that from a purely monetary perspective that this composite appears to remain “supportive” of the momentum of Oil prices ahead.
In fact, overall conditions for commodities as an asset class seem to be favoured by monetary conditions. Last week the CRB Commodity Price index rose by 3% and year to date is up by 6%.

We have constructed a proxy for the World Boom-Bust Cycle as presented below which can be broken down into 4 stages. In the more expansive stages of the cycle (e.g. Stage 2/Stage 3), when bubble activity is “strengthening”, we would expect capital intensive commodities such as energy and metals to perform relatively better than other commodities. In the more defensive phases of the cycle, when the money supply momentum is falling, demand for more “defensive” or “basic” commodities, such as food and grains, should be expected to perform better.
Our global boom-bust measure entered Stage 2 of the cycle in October last year and remains so at least until Q4 this year. Such a “bubble” environment has historically tended to favour more “cyclically” preferred commodities such as energy and industrial metals.

There is of course the risk that commodity prices have run somewhat ahead of the monetary fundamentals
No discussion of commodity prices would be complete without a review of the prospects for the price Gold. As indicated earlier, the price of Gold has risen by 31% this year in addition to a 27% increment in 2024 and 13% in 2023. The chart shows this dramatic price acceleration.
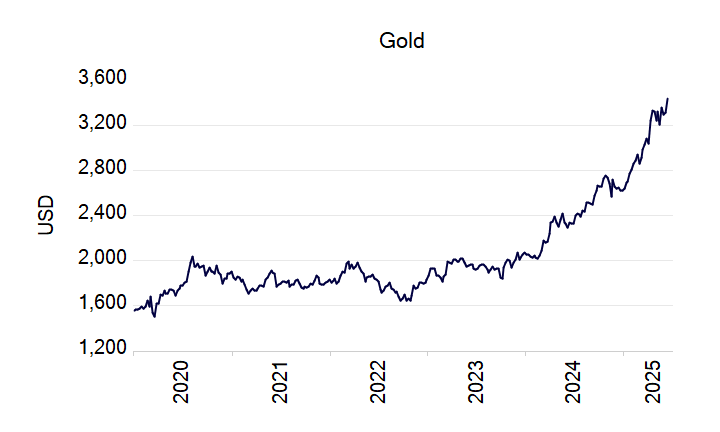
What does monetary momentum suggest? The lags between the money supply growth rates of the major consumer of Gold and the Gold price growth rate are significantly longer than they are for the other commodities mentioned – indeed around four years.
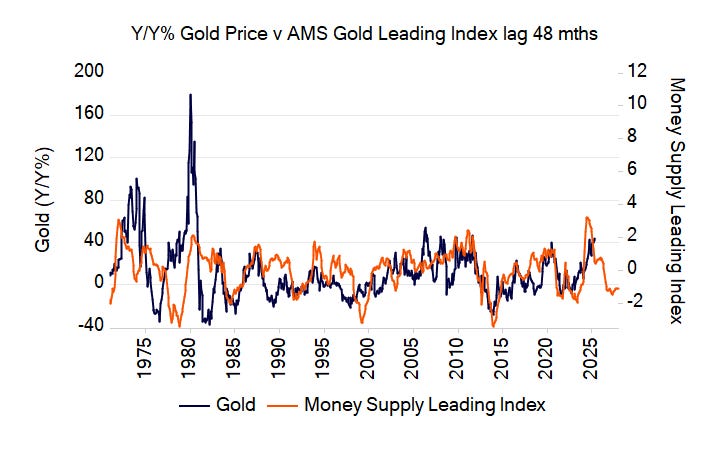
As always with every market there are seasonal and irregular factors that deliver significant noise about the core driver, but nonetheless the outlook here is for a slow loss of annual momentum for the price of Gold over the next few years. As can be seen from the chart, with the current year-on-year growth of Gold at over 40%, a slowdown from these levels probably implies more (but diminishing) price gains in the short term.
