


Money Supply & Macro Weekly #11
Data galore from central banks, China, US, Switzerland, Japan and Brazil

China
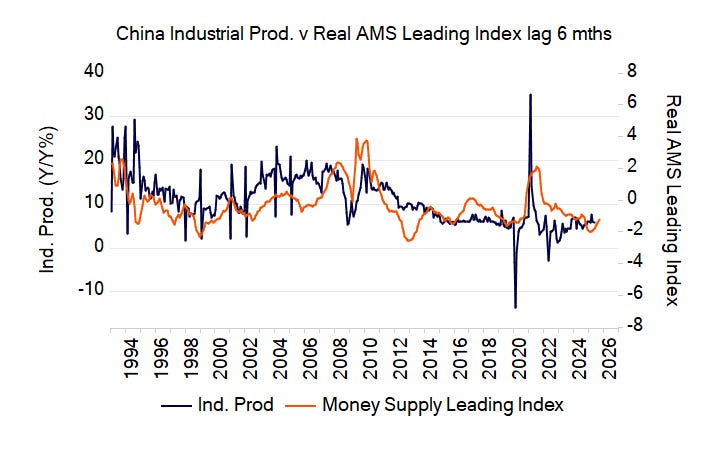
Chinese industrial output edged down to 5.8% in May from 6.1% in April and 7.7% in March. Our composite lagged monetary measure for China suggests that the yearly growth rate of industrial production is not far from its bottom and likely to rebound modestly over the coming six months or so.
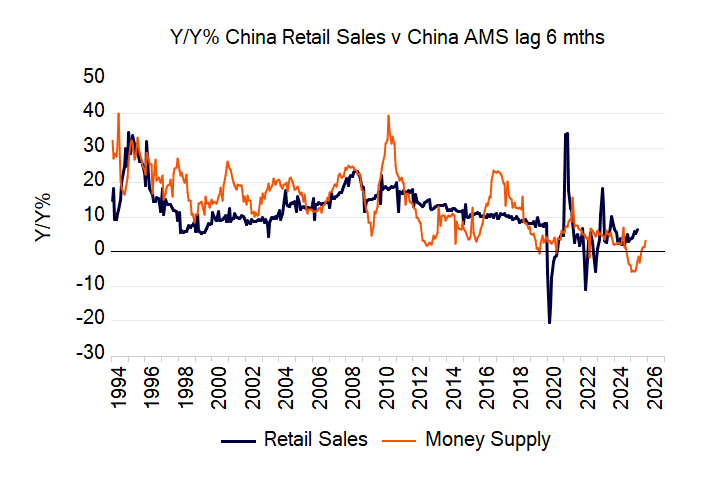
In contrast to industrial output growth, the Chinese consumer seems to have continued to spend with the annual growth rate of retail sales rising to 6.4% in May from 5.1% in April. Furthermore, it has been trending up in recent months.
Domestic money supply momentum has been trending up since September of last year. It seems the beneficiaries of this latest monetary pumping have been the Chinese consumer.
Chinese newly built house prices fell by 0.2% in May although annual momentum seems to be slowly trending upwards. Year-on-year it stood at -3.5% in May versus -4% in April and -5.9% in October last year. If lagged money supply growth is any measure, then we should continue to see the momentum of house prices improving in the months ahead.

The People’s Bank of China ended last week keeping its policy rate unchanged. The 1-year loan prime rate is at 3% whilst the 5-year loan prime rate remains at 3.5%. Signs of de-escalation in trade tensions may have reduced the urgency to lower rates further.
However, regardless of these trade tensions, one must consider whether there are some other fundamental underlying problems with the Chinese economy following the relentless monetary pumping. We can see from the chart below that despite the underlying trend of the policy rate having been in decline for over a decade (shown as inverted) lending growth has continued to slow, now being at historically low levels.

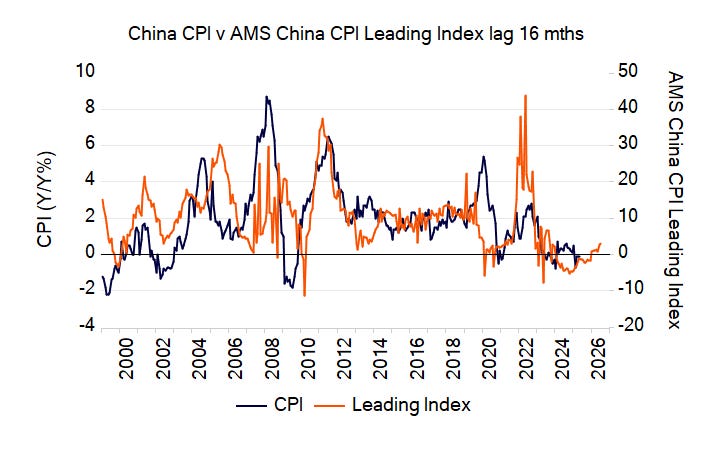
One should also perhaps keep an eye on the outlook for Chinese “inflation”. Currently the Chinese CPI is in the “deflation” zone and our leading indicator, which is driven by the money supply, suggest could will remain subdued for most of the remainder of this year.
US
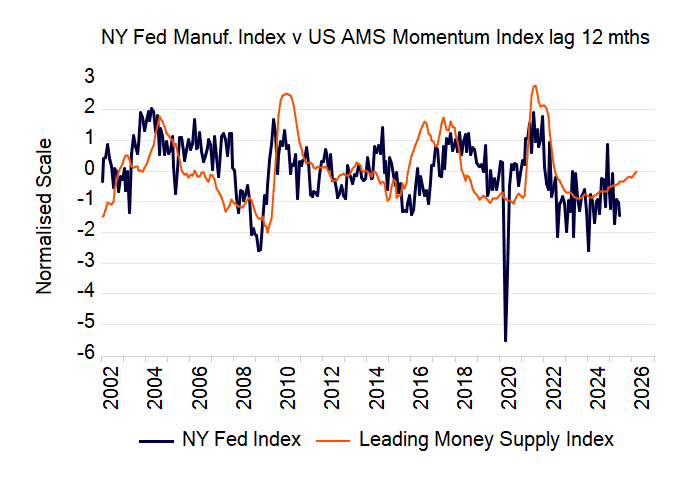
The US data released last week showed economic conditions softening. For example, the New York Fed manufacturing index decreased to -16 this month from -9.2 in May. if we follow the lagged momentum of the US AMS index then the New York Fed manufacturing index is likely to revert to trend and strengthen in the months ahead.
US industrial output also declined by 0.2% for the month of May. The yearly growth rate also slowed to 0.6% in May from 1.4% in April. It stood at 0% in May last year. This decline is entirely consistent with our expectation for a very slow, modest improvement in growth outcomes for the US economy.

Retail sales also fell in May in the US, down by 0.9%. The yearly growth rate of retail sales also decreased from 5% in April to 3.3% in May. The expected trend for retail sales, however, is not as positive in slope as it is for industrial production. Here the outlook is for flat or slightly declining US retail sales growth ahead.

The housing market also still remains on shaky ground. Building permits fell by 1.3% for the month of May whilst Housing Starts plunged by 9.8%.
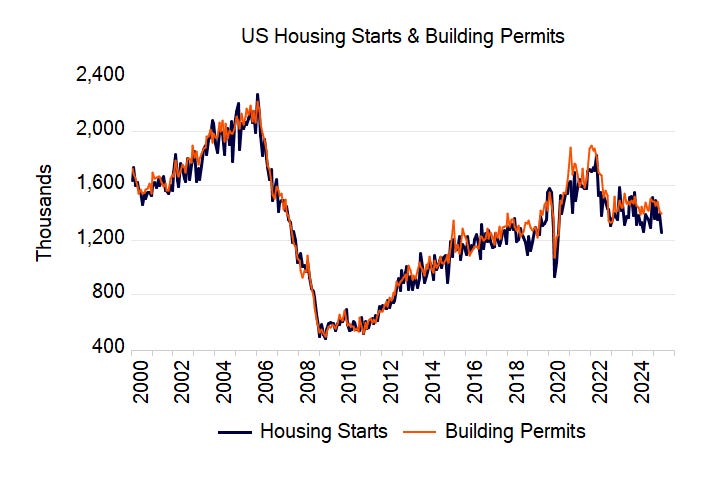
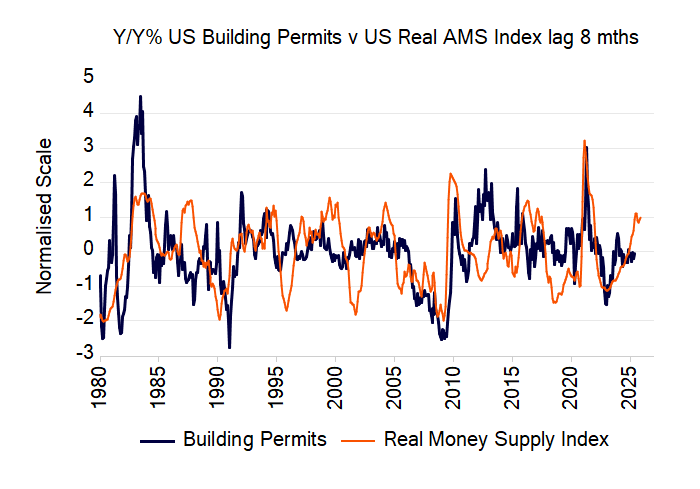
Will the housing market recover, especially if policy rates don’t fall as much as Trump would like them to? It’s difficult to say, as data series here are volatile, but the housing market is sensitive to mortgage rates (which are not declining) but also to fluctuations in the money supply growth rate (lagged values of which are on the rise). This cycle definitely is different from prior cycles. First, here’s the impact of the money supply.
Secondly, here’s the “conundrum” of bond market yields. The Fed has been easing since August last year. One would normally (but not always) assume that a loosening in monetary policy would be associated with an expansion in the Fed’s balance sheet. However, since August last year, the Fed balance sheet has continued to shrink – declining by over $470 billion over this period and typically a sign of contractionary policy! It comes as no surprise that US bonds yields are resisting Trump’s urge for them to head south.

The Federal Reserve also late last week decided to keep the Federal funds rate target at 4.5%. For what it’s worth (since we prefer to focus on money supply), the lagged inverted momentum of the Fed’s target rate raises the likelihood that economic activity is not far from a bottom, and especially moving into 2026 we may see a bounce in growth, something that our money supply indicators are also suggesting.

Whilst policymakers have signalled that rates may still fall in 2025, Fed Chair Powell cautioned against putting too much weight on that view, expressing concerns about “meaningful” inflation as a result of the tariffs. This is also something we have alluded to in prior Weeklies when we have examined the CPI outlook. Yes, there is still the possibility of further downside in the short-term, but as we move into 2026 this could reverse.

Central Banks
Last week saw a large number of central banks release their policy rate decision for June. Most were unchanged although the majority underlying trend is down.

The standout here has to be Switzerland. It only feels like last year (actually it was) that the SNB’s policy rates had peaked at 1.75%. Now it has cut rates to 0%.

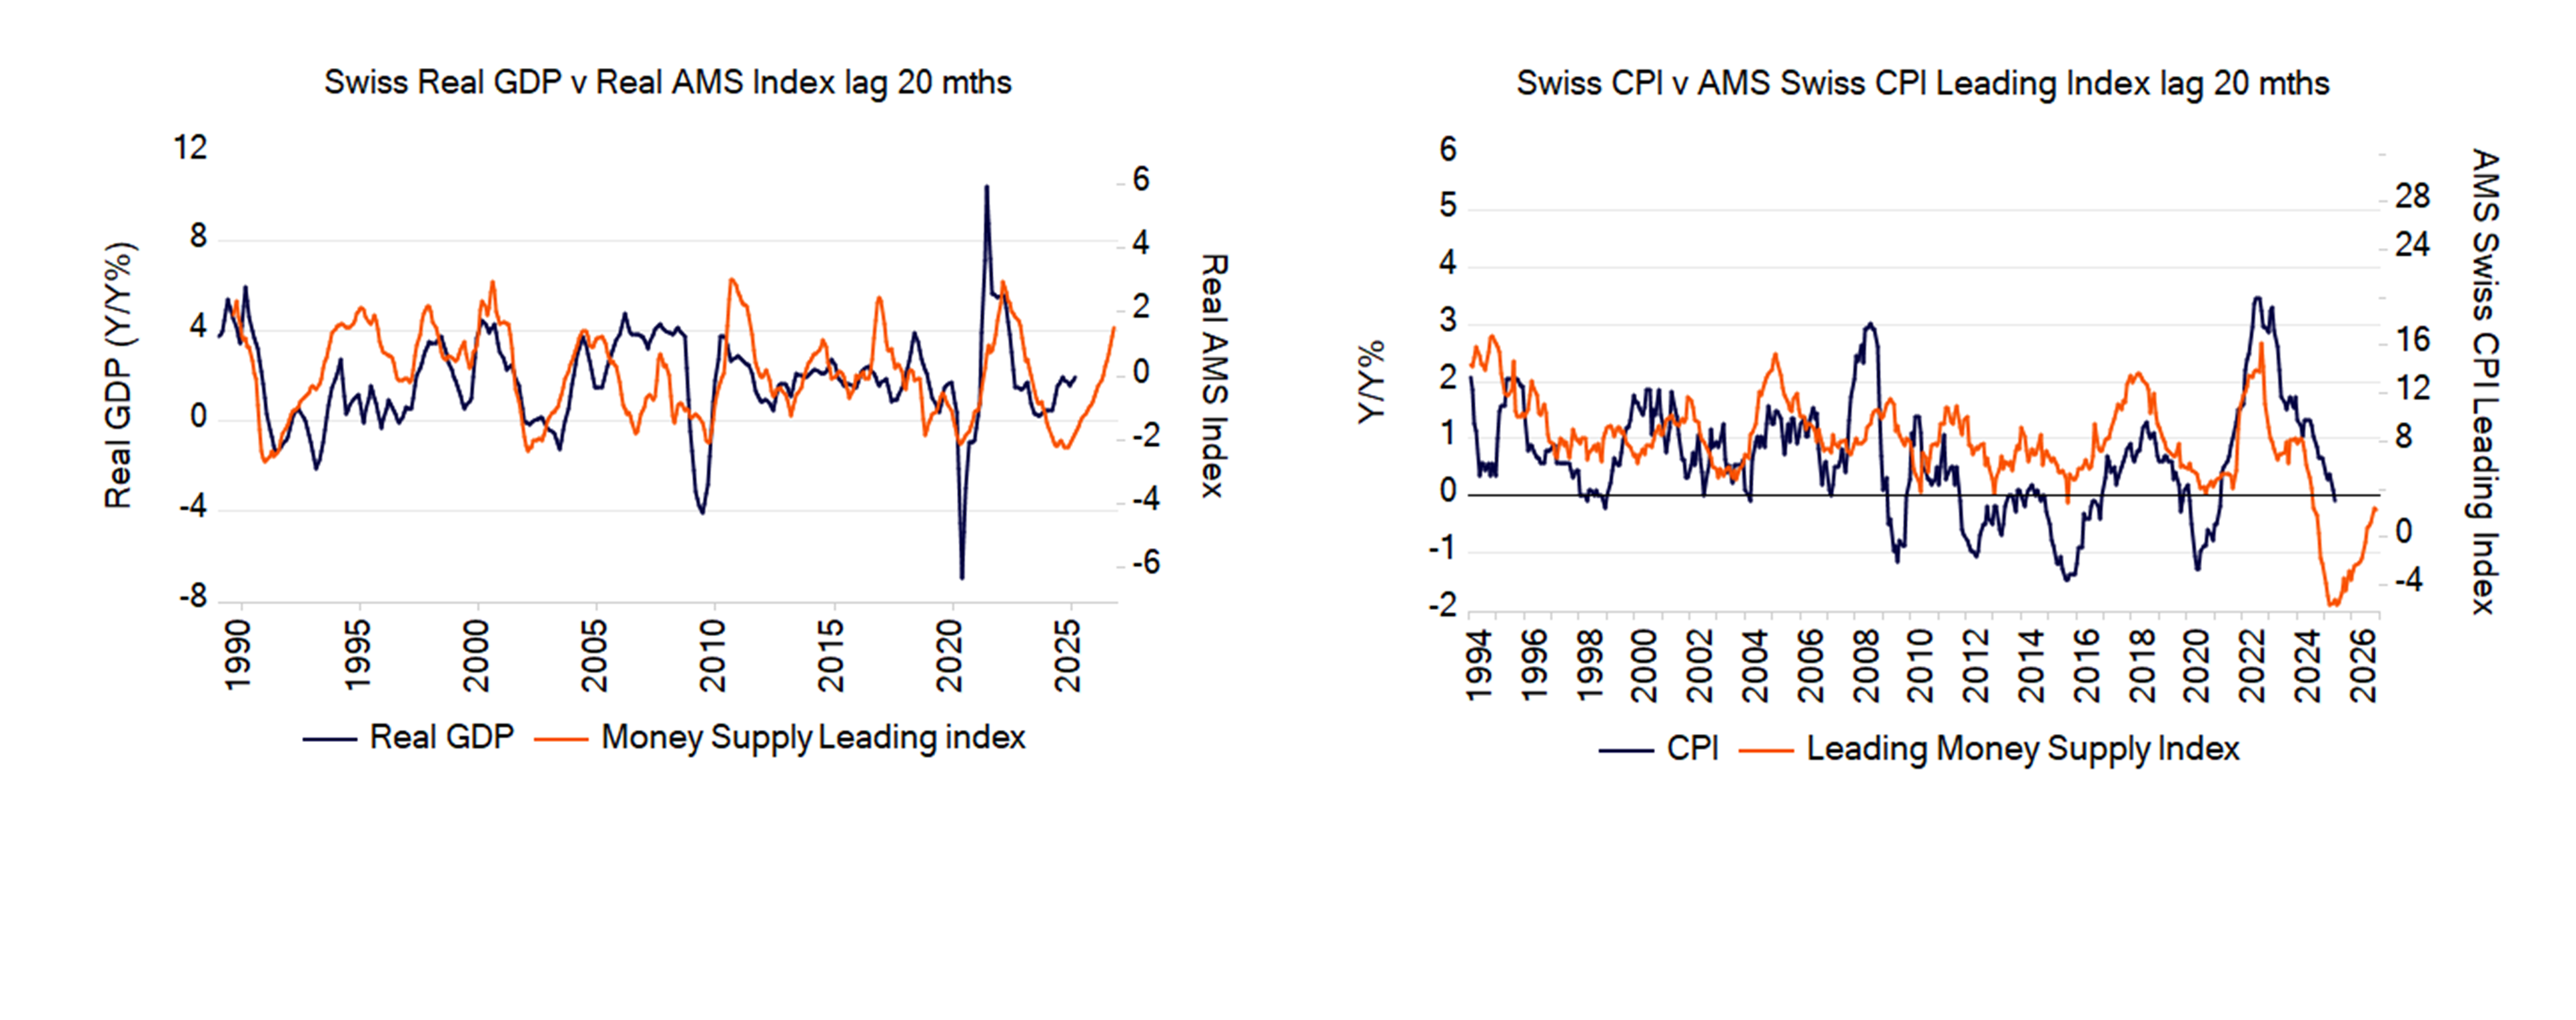
What’s also concerning is that the SNB also did not rule out policy rates going negative in the future. This is interesting as, per our monetary measures. growth conditions could improve in Switzerland next year and CPI inflation looks set to head north.
The other standouts from the table below are Brazil and Japan who are still maintaining a tightening stance. Conventional mainstream theory would suggest that this differential in monetary policy between two countries should benefit the currency of the country tightening. This seems to be the case with the Brazilian Real, with our excess money differential (see terminology) between the US and Brazil now favouring higher relative momentum of the Real. This has been the case for all of 2025 and year-to-date we have seen the USD/BRL fall by 10.8% (i.e. a strengthening BRL).

The outlook for the Yen is a little more volatile, howeve the excess money differential does indeed support a stronger Yen at least until around year-end.
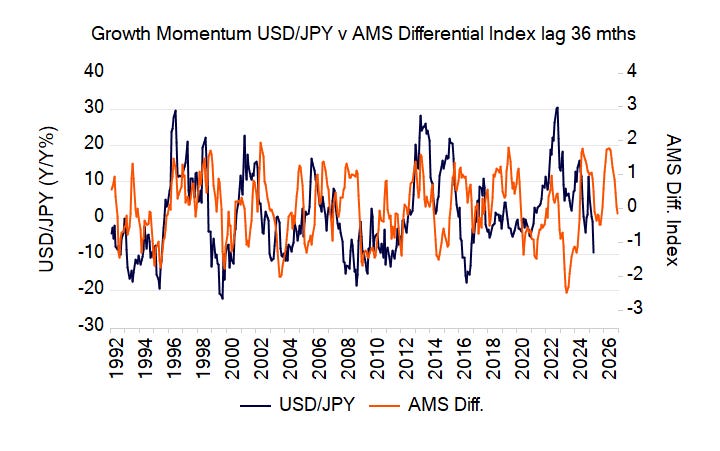
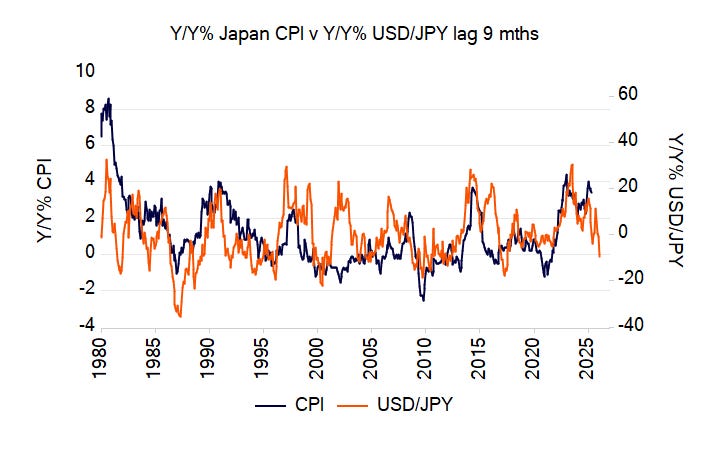
Despite keeping rates unchanged this week at 0.5%, the BoJ hawks are still ascendant, buoyed by the release of Japanese CPI. The headline number edged down to 3.4% year-on-year in May from 3.5% in the prior month. However, focus was on the core CPI which rose to 3.7% from 3.5%. Is Japan about to experience a resurgence in inflation? Our lagged money supply indicator suggests that, rather, we may be around a peak in inflation.

The weakening in momentum of the USD/JPY seems to support this as well.
Furthermore, cracks continue to grow in the economic outlook in Japan. Trade data were also released last week and showed a visible deterioration in imports. Year-on-year Japanese imports declined to -7.7% in May from -2.2% in April. The yearly growth rate of exports also fell to -1.7% in May from 2% in April. The lagged yearly growth rate of Japan’s real AMS index raises the likelihood that the momentum of imports will weaken further ahead.

