


Money Supply & Macro Weekly #12
We don't think President Trump will be happy with this...

Is there any predictive utility in the US Federal Funds rate? Since the Feds Funds Rate is a reflection of the looseness or tightness of monetary policy, one would expect it to give us a lead on the likely direction of US money supply growth and therefore on all of the downstream indicators driven by money supply growth.
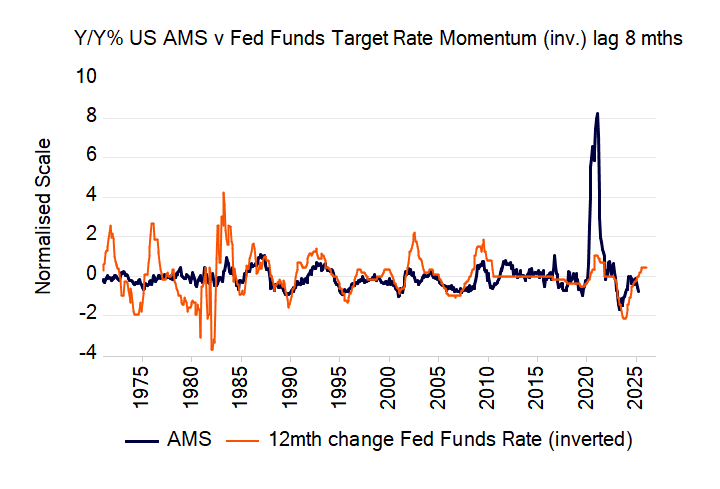
It also gives us a guide as to where US benchmark Treasury bond yields might be heading in a “normal” cycle.
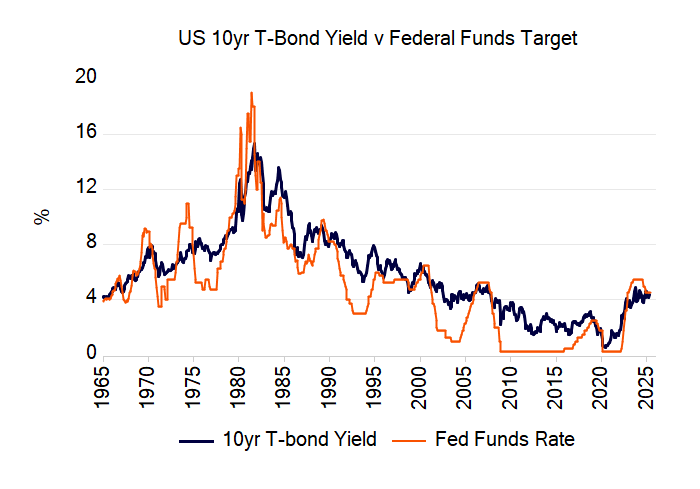
We also know that movements in this key rate tend to be (inversely) associated with movements in the shape of the US Treasury yield curve.

This key policy rate is in fact a measure of the direction and magnitude of US central bank interference in the economy, an interference occasioned by acting in the debt securities market by buying and selling so as to force short term rates to a particular point. As the Fed can print as much money as it likes it has limitless resources at its disposal to achieve its desired target, which delivers to us the well-known market adage “Don’t fight the Fed.”
It would thus be useful to be able to predict the overall trend and the major turning points in the Fed Funds rate itself. Let’s see if we can.
Federal Reserve Balance Sheet
The Fed’s balance sheet has now shrunk to $6.68 trillion, down from a peak of $8.97 trillion in April 2022.

This represents a decline of $2.28 trillion – or 25.5% - from the peak, which is the largest percentage decline since 1960 – the beginning of our records.

The yearly growth rate of the Fed’s asset book is now -7.9%, which is down from its peak of 85.5% in June 2020 but up from recent lows of -13.7% p.a.

Fed Policy Objective #1: Price Stability
As we know, the Fed is charged with maintaining price stability and, at the same time, maximum employment growth consistent with that price stability – the famous “twin policy objectives”.
To focus firstly on price stability, one of the Fed-favored indicators is the Personal Consumption Expenditure (PCE) deflator. Currently, the year-on-year change in the PCE is 2.5%.

More frequent (monthly) data that approximate the PCE are reflected by the core CPI. Here the year-on-year rate of core inflation is 2.8%.

Our leading indicator of Core US CPI inflation – based on lagged Adjusted Money Supply (AMS) growth rates – suggests that the recent downward pressure on inflation continues until the end of 2025. After that time the disinflationary pressure ebbs and we begin to move back towards a more pro-inflationary environment.

With “headline” CPI inflation the monetary lags are shorter and here the likely bottom in inflation is a quarter or so earlier.

Thus, if these lags continue to hold, we could see US inflation bottoming towards the end of 2025 or in the first quarter of 2026.
Fed Policy Objective #2: Maximum Sustainable Employment
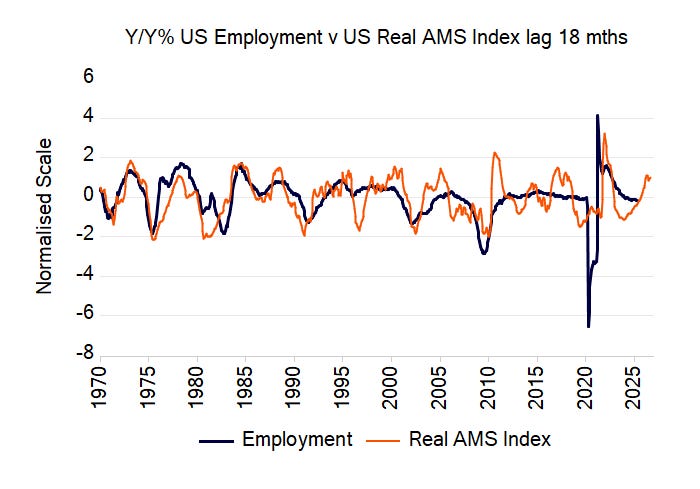
When we turn to the second of the twin policy objectives, we see that US non-farm payrolls have grown by 1.1% p.a. as at the latest data release (May).

Our leading monetary indicator of US employment growth is suggesting that job growth should increase from here.
Further, our real money supply (AMS) leading indicator suggests that the annual rate of change of the US unemployment could see a gentle trend towards a reduction in that rate over the next year or so.
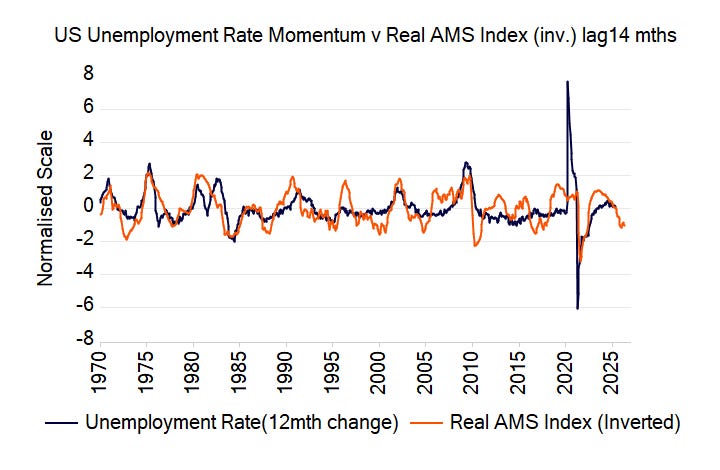
On account of these lags and trends, we could see the US job market showing some improvement over the next year or so.
Combing the Twin Objectives
Combining the two data sets (i.e. inflation and employment growth) below provides a glimpse into “the mind of the Fed”, at least in terms of the dates and directions of likely movements in the Fed Funds rate.

From this chart we can see that major turning points in the Fed Funds rate often occur at major turning points in a (smoothed) combination of inflation and employment growth. This makes sense given the Fed’s stated objectives.
Predicting the Twin Objectives
Given our ability to predict the likely annual growth rate of both the CPI and non-farm payrolls using our money-supply-driven indicators, it is possible to predict this key combined variable. This can give us a lead on the Fed’s thinking with respect to likely changes in the Fed Funds rate.

Whilst by no means a perfect indicator, we can see that the recent application of the 15-month-lagged variable gave a reasonable indication of the timing of the most recent Fed pivot to easing. The chart is suggesting that we could be looking at a pivot or reversal of the current easing cycle around Q1 next year. This would imply that current market expectations of continued Fed easings well into 2026 may be ill-founded and that we may indeed see the opposite of this towards the end of this year or early in 2026.
If this turns out to be the case then the US bond market (and probably numerous bond markets) could be in for a nasty surprise.
Please do not forward this to President Trump!