


Riding the Tech Tiger
It’s been a wild couple of months for stocks and, once again, Tech stocks have been at the forefront.
Does this mean that all things non-Tech are non-starters? Are long-held investment principles now outdated? Do primary drivers like changes in the money supply growth rate no longer matter?
We don’t think so.
We remain firmly of the view that observing the money supply is of vital important. This allows us (and, hopefully, you) to determine where we are in the central-and-commercial-bank-driven boom-bust cycle and how to navigate it successfully.
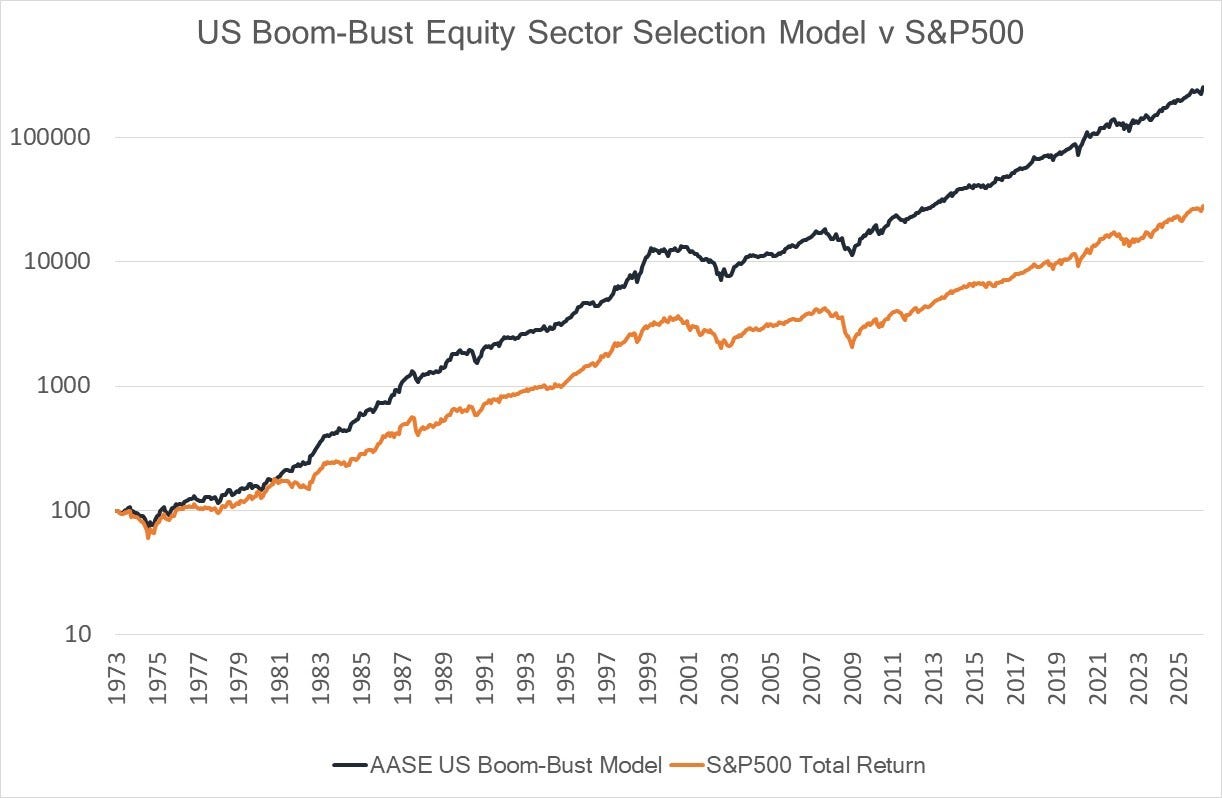
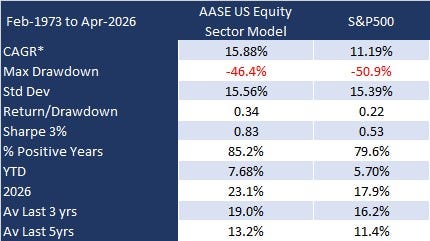
We’ve shown previously that an approach focussed on allocating via the boom-bust monetary cycle can generate superior notional performance over the medium and longer term. Below are tabular results of the approach as applied, for example, to sectors in the US market:
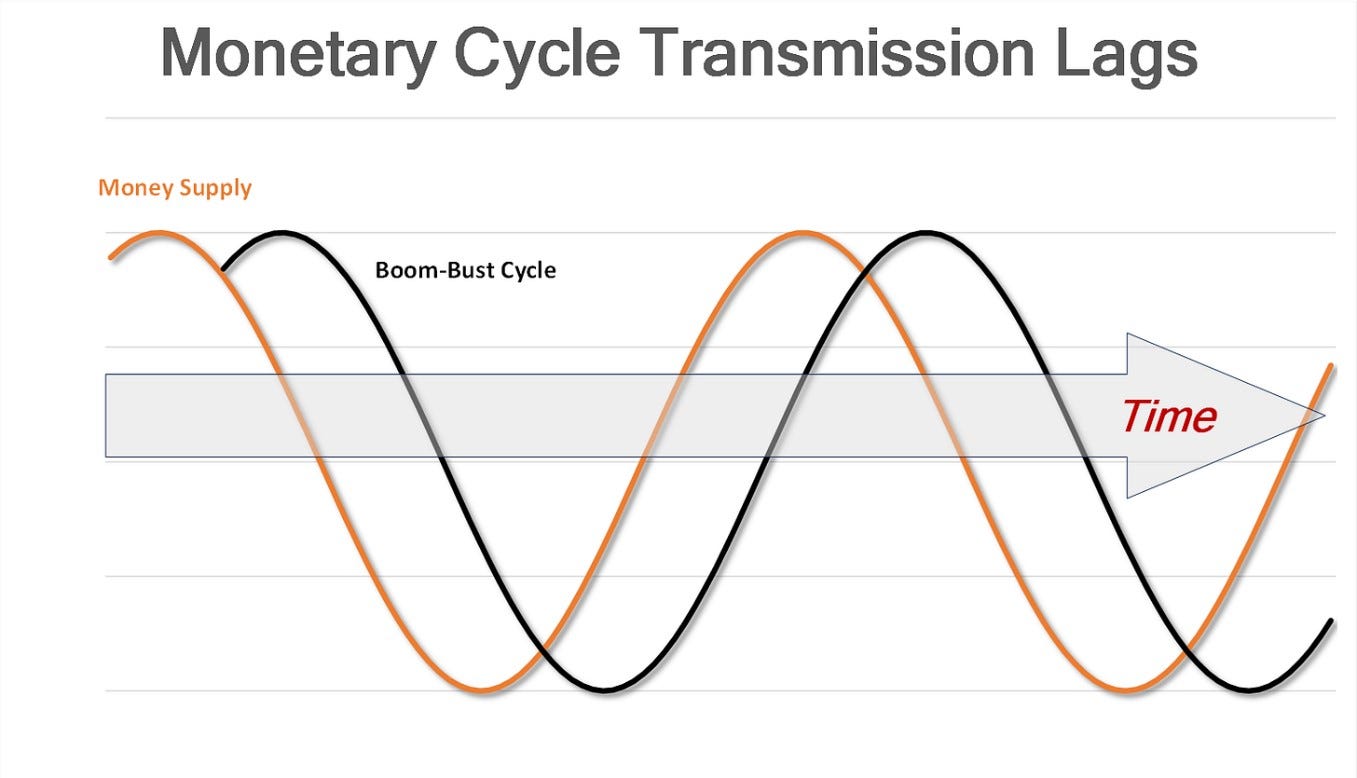
As readers know, we repeatedly show that changes in money supply constitute a leading indicator and that they produce the classic cycles of boom and bust that characterise the economy and the markets.
We also show that there are time lags between when new money is created and when that new money ripples out from earlier recipients to later recipients - and thus from one part of the economy to another.
We utilise changes in money supply to establish a forward-looking framework indicating which stage of the cycle we anticipate the economy to be entering. By modifying the standard money supply definition to better reflect the true nature of money we are able to better predict the business cycle and its stages.
We know, too, that different assets (and indeed different segments within an asset class) perform better at different stages of the cycle and it is possible to measure and record historical performance by stage. Then, by mapping the upcoming stage of the cycle to the potentially optimum asset mix, it is theoretically possible to improve portfolio decision-making.
This is what we attempt do on a systematic, rules-based basis, dividing the cycle into four stages and mapping these stages to asset returns.
Thus if we know the forthcoming stage – which we do thanks to the lagged effects of money supply changes - we can position portfolios to potentially benefit from this stage. We also add an overvaluation metric to avoid being caught in blow-off tops in any sector.
A more detailed discussion of our process and the logic surrounding it can be found in our previous post here.
This report reflects the application of our approach to the allocation of capital across different stock market sectors.
Here are our two key framework charts:
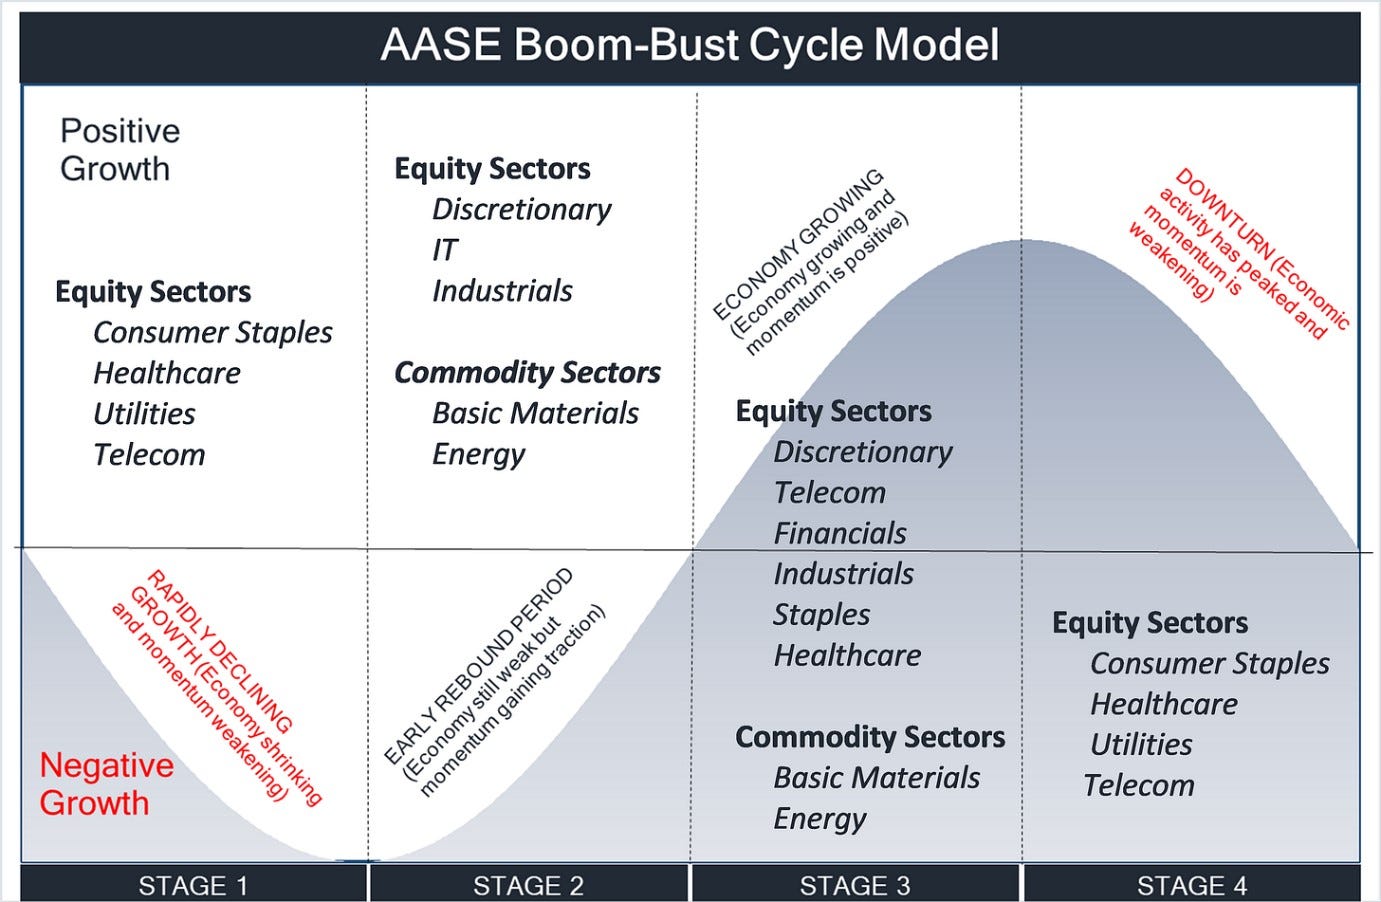
This template is varied slightly according to the industrial structure of each particular economy.
In this month’s edition of our sector allocation modelling we update subscribers with our latest portfolio changes.
Contents
US Sector Allocations
European Sector Allocations
Japanese Sector Allocations
Australian Sector Allocations
UK Sector Allocations
Canadian Sector Allocations
We begin with the US.
The US Boom-Bust Cycle
The US Boom-Bust Cycle remains in Stage 2 - the rebound period. The dotted line reflects the trajectory over the next 12 months.
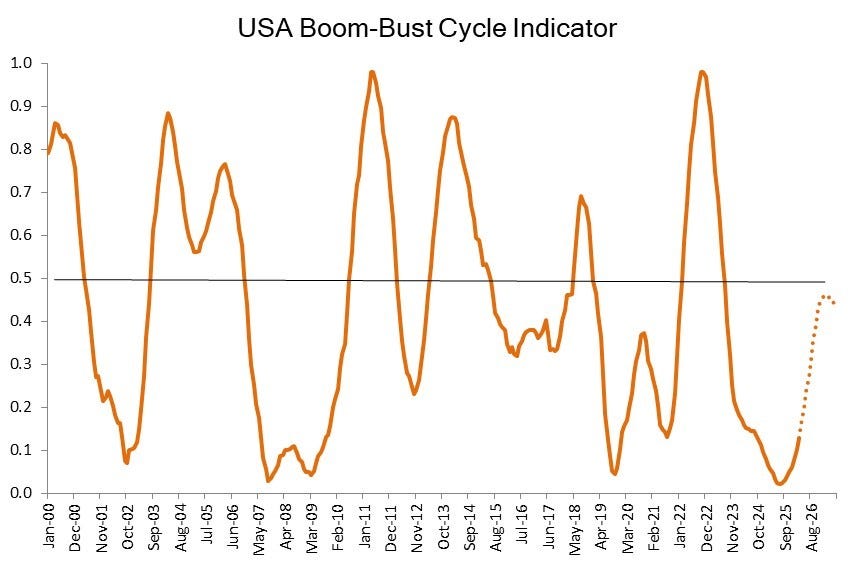
This predisposes our model to pro-cyclical, “risk-on” allocations.
